
Key Metrics & Predictors
Director, Enstoa
An Update to Capital Projects KPIs
I’d like to talk for a bit about capital projects metrics. Working in capital projects for the past decade, Enstoa has developed a suite of metrics to help capital-intensive companies to better understand how well their capital program is delivering value, to provide insight into performance trends, and to identify areas of improvement. We use Return on Capital Employed (ROCE) as a proxy for measuring project excellence in organizations and gauging a company’s capital effectiveness and efficiency. ROCE is defined as Earnings before interest and taxes (EBIT) divided by the total amount of capital assets employed by the company. Looking at this in a little more detail, we see that increasing the overall ROCE can be impacted by many factors around a company’s asset base, such as:
- Maximizing revenue from capital investments
- Optimizing value creation from capital expenses
- Efficient use of working capital
There are many influencers and moving parts in determining the overall ROCE for a company, but from a capital project perspective, improving project excellence contributes towards an increase in returns. In this blog, I’ll provide detail about specific capital project metrics in Enstoa’s Key Metrics and Predictors program that support a company’s ROCE.
Maximizing Revenue From Capital Expenses
Achieving In-Service Dates
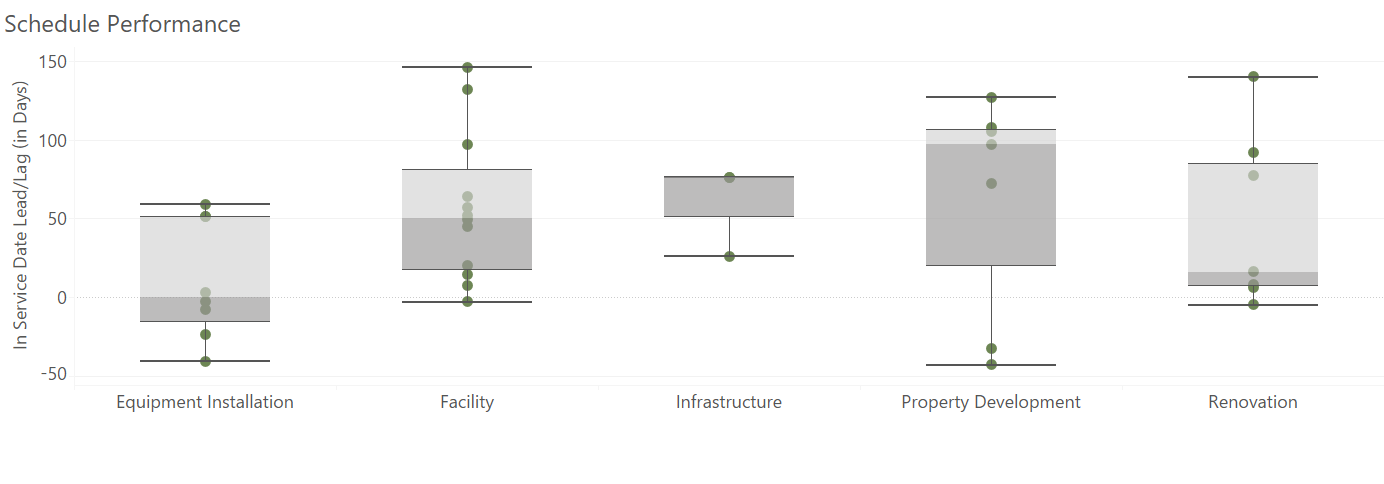
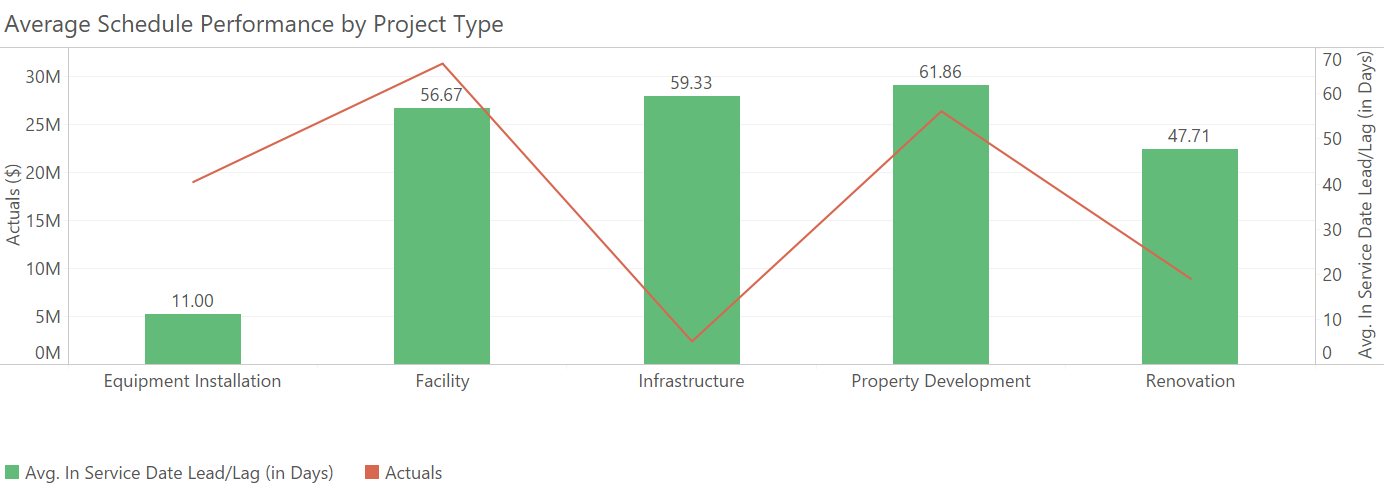
Schedule performance of capital programs has a considerable influence on a company’s ROCE, particularly on revenue and capital expense. Business cases around projects are built with certain assumptions in mind, e.g., when the project will be completed and the asset turned over to operations, what is the revenue profile for the life of the asset produced by the project, and how business climate and changing conditions can affect the assumptions of the productivity of the asset. When a project’s schedule is delayed, it is not only the revenue stream which negatively impacts ROCE delay (e.g., an asset that generates $100,000 USD per day in revenue with a planned annual return of 30% will lose $3,000,000 USD in revenue and $900,000 USD in operating margin for a 30-day schedule slip), but also the changes to the in-service timing and corresponding business environment can undermine the basis of the project’s business case.
As a part of the Key Metrics and Predictors program, we look at how accurately an organization can forecast an asset’s In-Service Date based on actual project performance. This metric is characterized by division and business unit, along with other project attributes (e.g., project type, size, delivery model, location, timing, etc.) to identify performance standards for the organization. This data helps uncover opportunities for improvement in project excellence by introducing processes to reduce variability (i.e., improved predictability and increased confidence in In-Service Date estimation) and to improve performance (reducing project cycle time).
Optimizing Value Creation From Capital Expenses
Staff Efficiency
How do we get the most bang for our buck? Looking past project selection for the moment (more about that soon), value creation can be improved from efficiently delivering projects to operations. Enstoa’s Key Metrics and Predictors program keep an eye on capital efficiency by looking at the volume of projects delivered by the organization with the Staff Efficiency metric. This metric identifies, for different project types and delivery models, the number and scale of projects managed by an organization. As an internal barometer, this helps leaders to better understand the capabilities of our organization, allows us to see how organization process improvement initiatives impact workload, and anticipate future human resource needs.
Cost Performance
Mature organizations understand the value of standardized and disciplined project estimating. They utilize historical data, parametric estimating, and expert heuristics to develop estimates consistently. They gather inputs from consultants and team members to critically analyze scope and increase reliability of estimates. Also, they continually feed back results to improve estimate quality. However, most organization lack confidence either in the ability to estimate projects or their capability to deliver projects to estimates. We establish evidence-based benchmarks and targets for the organization’s varied types of capital project investments to create visibility and increased accountability for cost performance. Having these metrics in place allows us to identify variances and provides a basis for isolating causes of the variances, thus empowering the business to effect real change with measurable results.
Change Management
Projects are inherently uncertain and the most successful organizations develop the capability to effectively identify and manage project change. In order to properly quantify the impact of change, we identify the schedule implications that affect the business case of the project. As a starting point, we look to classify the types of project changes (and their respective causes) with the objective to minimize impact, mitigate future risk, and potentially recover cost and/or schedule. In addition, we also analyze down-stream impacts such as dependent projects, and other potential effects to the portfolio due to resource constraints.
Efficient Use of Working Capital
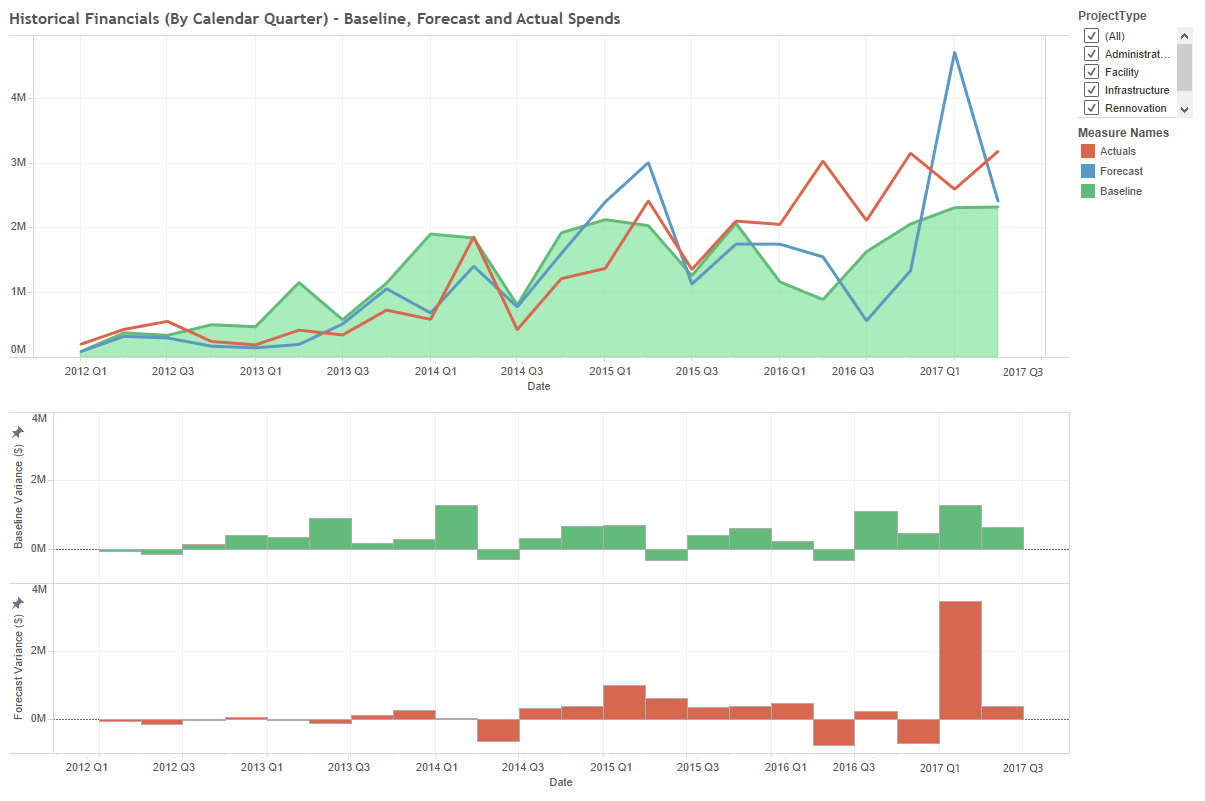
It is often beneficial to think of investments in terms of opportunity costs. As funding is approved for a new capital project from cash reserves or cash flow, this implies that the capital investment is the highest and best use of the company’s capital after considering all possible alternatives. When the actual capital expenses vary significantly above or below the capital expense forecast, there is a price to pay in the lost opportunity for each unspent or overspent dollar. Often enough, there is room for improvement in the way capital expense is forecast, tracked, and controlled.
Latent Budget
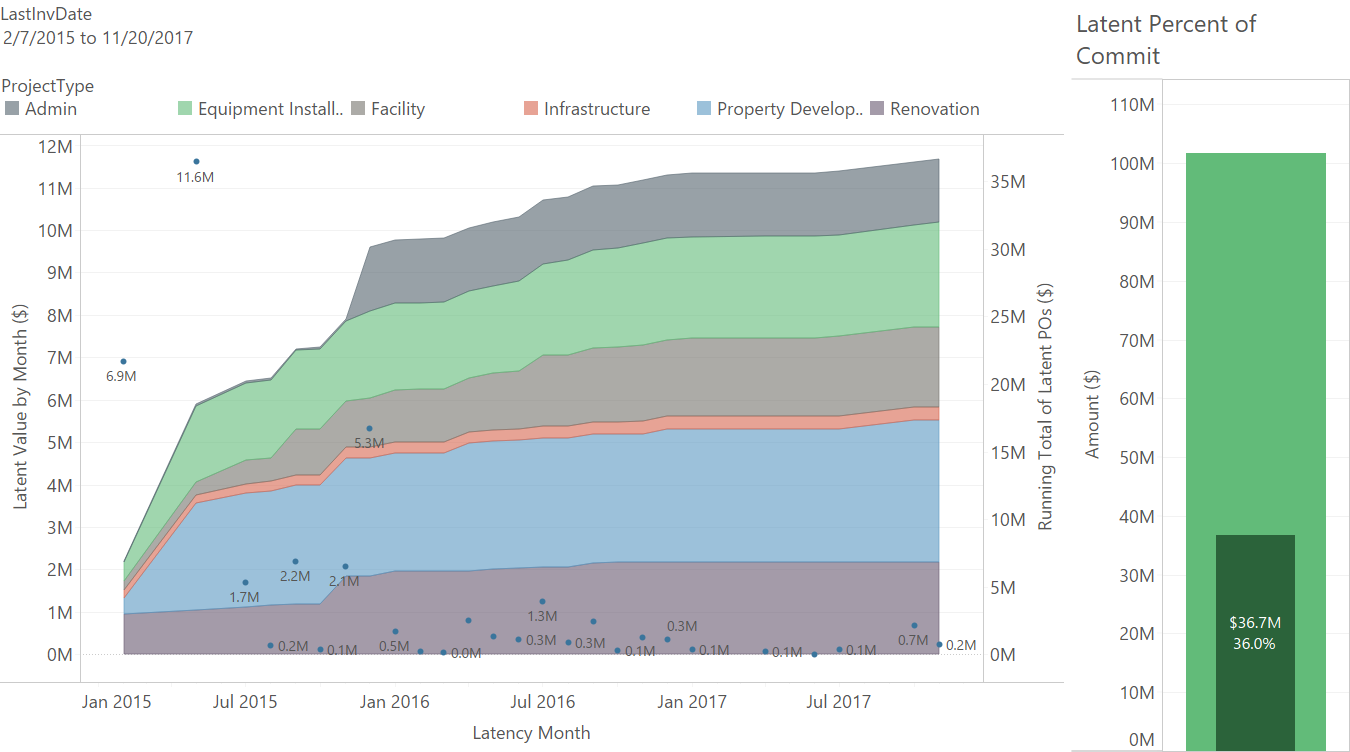
The aggregated performance of capital spending can characterize how effectively an organization can apply its capital funds. When analyzing budgets versus actual spends, often there are patterns of rushed or erratic capital spending that may exceed plans and put strains on the organizations funding. This kind of behavior may result in delayed project starts or increased costs of capital to meet commitments to active projects. Also, when the resource constraints of the capital program limit the volume of work to lower levels than planned the result is an underspend toward capital commitments. These kinds of patterns create inefficiencies in how capital is managed.
Latent Commitments
Purchase orders and other types of contractual commitments represent a financial obligation for the company. Efficient financial processing ensures that only appropriate commitments are maintained in an open state. Latent Commitments are defined as any commitment instrument (e.g., PO) that has been open for greater than 120 days. In some cases, a latent commitment may represent unused/unneeded funds, or it may be that POs that were not closed as part of project close-out activities. Whatever the reason, latent commitments can lead to inaccurate financial reporting and uncertainty over funding requirements, so it is important to know what % of its commitments are ‘latent’ at any point in time and drive improvements to contract management processes.
Capital Expense Forecasting Accuracy
How well does your organization forecast its cash flow needs? We look at cashflow forecast accuracy from the project level and aggregate spend and forecast data up to the portfolio. Grouping and the filtering the data across business units or divisions and project types to leads to better understand the forecasting capability of the organization and to identify causes or unanticipated spends.
In some cases, these metrics are developed as an instantaneous snapshot of a company’s capital program. The process is insightful and helps to identify gaps in a how a capital program operates and recommendations to close those gaps. While helpful, an even greater value can be derived from a metrics program that uses recurring snapshots (daily, typically) to build trend profiles on the metrics over time. This gives an organization a strategic opportunity to evaluate the impact of performance improvement initiatives as well as a tactical opportunity to anticipate and address unfavorable conditions and mitigate against lapses in capital efficiency.
Parting Thoughts…
Why are metrics important? Because they help to drive positive behaviors in an organization. Metrics don’t just tell us where we’ve been, but also play a critical role in defining where we are going. On a practical note, metrics analysis should not be a science project, but, unfortunately, the use of metrics to aid in analysis is often overlooked due to the difficulty in obtaining the right data.
The takeaway? Invest in your data – it’s a powerful asset for your organization. Dive deep into the data models, increase your understanding of the evolving digital characteristics of your organization, and unlock the value of your digital assets.
Michael Goggin is a Director at Enstoa. His passion for analysis is grounded in data and aims to uncover actionable intelligence in Capital Programs. Connect with Michael here.
An Update to Capital Projects KPIs
I’d like to talk for a bit about capital projects metrics. Working in capital projects for the past decade, Enstoa has developed a suite of metrics to help capital-intensive companies to better understand how well their capital program is delivering value, to provide insight into performance trends, and to identify areas of improvement. We use Return on Capital Employed (ROCE) as a proxy for measuring project excellence in organizations and gauging a company’s capital effectiveness and efficiency. ROCE is defined as Earnings before interest and taxes (EBIT) divided by the total amount of capital assets employed by the company. Looking at this in a little more detail, we see that increasing the overall ROCE can be impacted by many factors around a company’s asset base, such as:
- Maximizing revenue from capital investments
- Optimizing value creation from capital expenses
- Efficient use of working capital
There are many influencers and moving parts in determining the overall ROCE for a company, but from a capital project perspective, improving project excellence contributes towards an increase in returns. In this blog, I’ll provide detail about specific capital project metrics in Enstoa’s Key Metrics and Predictors program that support a company’s ROCE.
Maximizing Revenue From Capital Expenses
Achieving In-Service Dates
Schedule performance of capital programs has a considerable influence on a company’s ROCE, particularly on revenue and capital expense. Business cases around projects are built with certain assumptions in mind, e.g., when the project will be completed and the asset turned over to operations, what is the revenue profile for the life of the asset produced by the project, and how business climate and changing conditions can affect the assumptions of the productivity of the asset. When a project’s schedule is delayed, it is not only the revenue stream which negatively impacts ROCE delay (e.g., an asset that generates $100,000 USD per day in revenue with a planned annual return of 30% will lose $3,000,000 USD in revenue and $900,000 USD in operating margin for a 30-day schedule slip), but also the changes to the in-service timing and corresponding business environment can undermine the basis of the project’s business case.
As a part of the Key Metrics and Predictors program, we look at how accurately an organization can forecast an asset’s In-Service Date based on actual project performance. This metric is characterized by division and business unit, along with other project attributes (e.g., project type, size, delivery model, location, timing, etc.) to identify performance standards for the organization. This data helps uncover opportunities for improvement in project excellence by introducing processes to reduce variability (i.e., improved predictability and increased confidence in In-Service Date estimation) and to improve performance (reducing project cycle time).
Optimizing Value Creation From Capital Expenses
Staff Efficiency
How do we get the most bang for our buck? Looking past project selection for the moment (more about that soon), value creation can be improved from efficiently delivering projects to operations. Enstoa’s Key Metrics and Predictors program keep an eye on capital efficiency by looking at the volume of projects delivered by the organization with the Staff Efficiency metric. This metric identifies, for different project types and delivery models, the number and scale of projects managed by an organization. As an internal barometer, this helps leaders to better understand the capabilities of our organization, allows us to see how organization process improvement initiatives impact workload, and anticipate future human resource needs.
Cost Performance
Mature organizations understand the value of standardized and disciplined project estimating. They utilize historical data, parametric estimating, and expert heuristics to develop estimates consistently. They gather inputs from consultants and team members to critically analyze scope and increase reliability of estimates. Also, they continually feed back results to improve estimate quality. However, most organization lack confidence either in the ability to estimate projects or their capability to deliver projects to estimates. We establish evidence-based benchmarks and targets for the organization’s varied types of capital project investments to create visibility and increased accountability for cost performance. Having these metrics in place allows us to identify variances and provides a basis for isolating causes of the variances, thus empowering the business to effect real change with measurable results.
Change Management
Projects are inherently uncertain and the most successful organizations develop the capability to effectively identify and manage project change. In order to properly quantify the impact of change, we identify the schedule implications that affect the business case of the project. As a starting point, we look to classify the types of project changes (and their respective causes) with the objective to minimize impact, mitigate future risk, and potentially recover cost and/or schedule. In addition, we also analyze down-stream impacts such as dependent projects, and other potential effects to the portfolio due to resource constraints.
Efficient Use of Working Capital
It is often beneficial to think of investments in terms of opportunity costs. As funding is approved for a new capital project from cash reserves or cash flow, this implies that the capital investment is the highest and best use of the company’s capital after considering all possible alternatives. When the actual capital expenses vary significantly above or below the capital expense forecast, there is a price to pay in the lost opportunity for each unspent or overspent dollar. Often enough, there is room for improvement in the way capital expense is forecast, tracked, and controlled.
Latent Budget
The aggregated performance of capital spending can characterize how effectively an organization can apply its capital funds. When analyzing budgets versus actual spends, often there are patterns of rushed or erratic capital spending that may exceed plans and put strains on the organizations funding. This kind of behavior may result in delayed project starts or increased costs of capital to meet commitments to active projects. Also, when the resource constraints of the capital program limit the volume of work to lower levels than planned the result is an underspend toward capital commitments. These kinds of patterns create inefficiencies in how capital is managed.
Latent Commitments
Purchase orders and other types of contractual commitments represent a financial obligation for the company. Efficient financial processing ensures that only appropriate commitments are maintained in an open state. Latent Commitments are defined as any commitment instrument (e.g., PO) that has been open for greater than 120 days. In some cases, a latent commitment may represent unused/unneeded funds, or it may be that POs that were not closed as part of project close-out activities. Whatever the reason, latent commitments can lead to inaccurate financial reporting and uncertainty over funding requirements, so it is important to know what % of its commitments are ‘latent’ at any point in time and drive improvements to contract management processes.
Capital Expense Forecasting Accuracy
How well does your organization forecast its cash flow needs? We look at cashflow forecast accuracy from the project level and aggregate spend and forecast data up to the portfolio. Grouping and the filtering the data across business units or divisions and project types to leads to better understand the forecasting capability of the organization and to identify causes or unanticipated spends.
In some cases, these metrics are developed as an instantaneous snapshot of a company’s capital program. The process is insightful and helps to identify gaps in a how a capital program operates and recommendations to close those gaps. While helpful, an even greater value can be derived from a metrics program that uses recurring snapshots (daily, typically) to build trend profiles on the metrics over time. This gives an organization a strategic opportunity to evaluate the impact of performance improvement initiatives as well as a tactical opportunity to anticipate and address unfavorable conditions and mitigate against lapses in capital efficiency.
Parting Thoughts…
Why are metrics important? Because they help to drive positive behaviors in an organization. Metrics don’t just tell us where we’ve been, but also play a critical role in defining where we are going. On a practical note, metrics analysis should not be a science project, but, unfortunately, the use of metrics to aid in analysis is often overlooked due to the difficulty in obtaining the right data.
The takeaway? Invest in your data – it’s a powerful asset for your organization. Dive deep into the data models, increase your understanding of the evolving digital characteristics of your organization, and unlock the value of your digital assets.
Michael Goggin is a Director at Enstoa. His passion for analysis is grounded in data and aims to uncover actionable intelligence in Capital Programs. Connect with Michael here.